
⚡ THE ESSENTIALS IN 20 SECONDS
- A good digital shelf dashboard fits on one screen and takes 15 minutes to review.
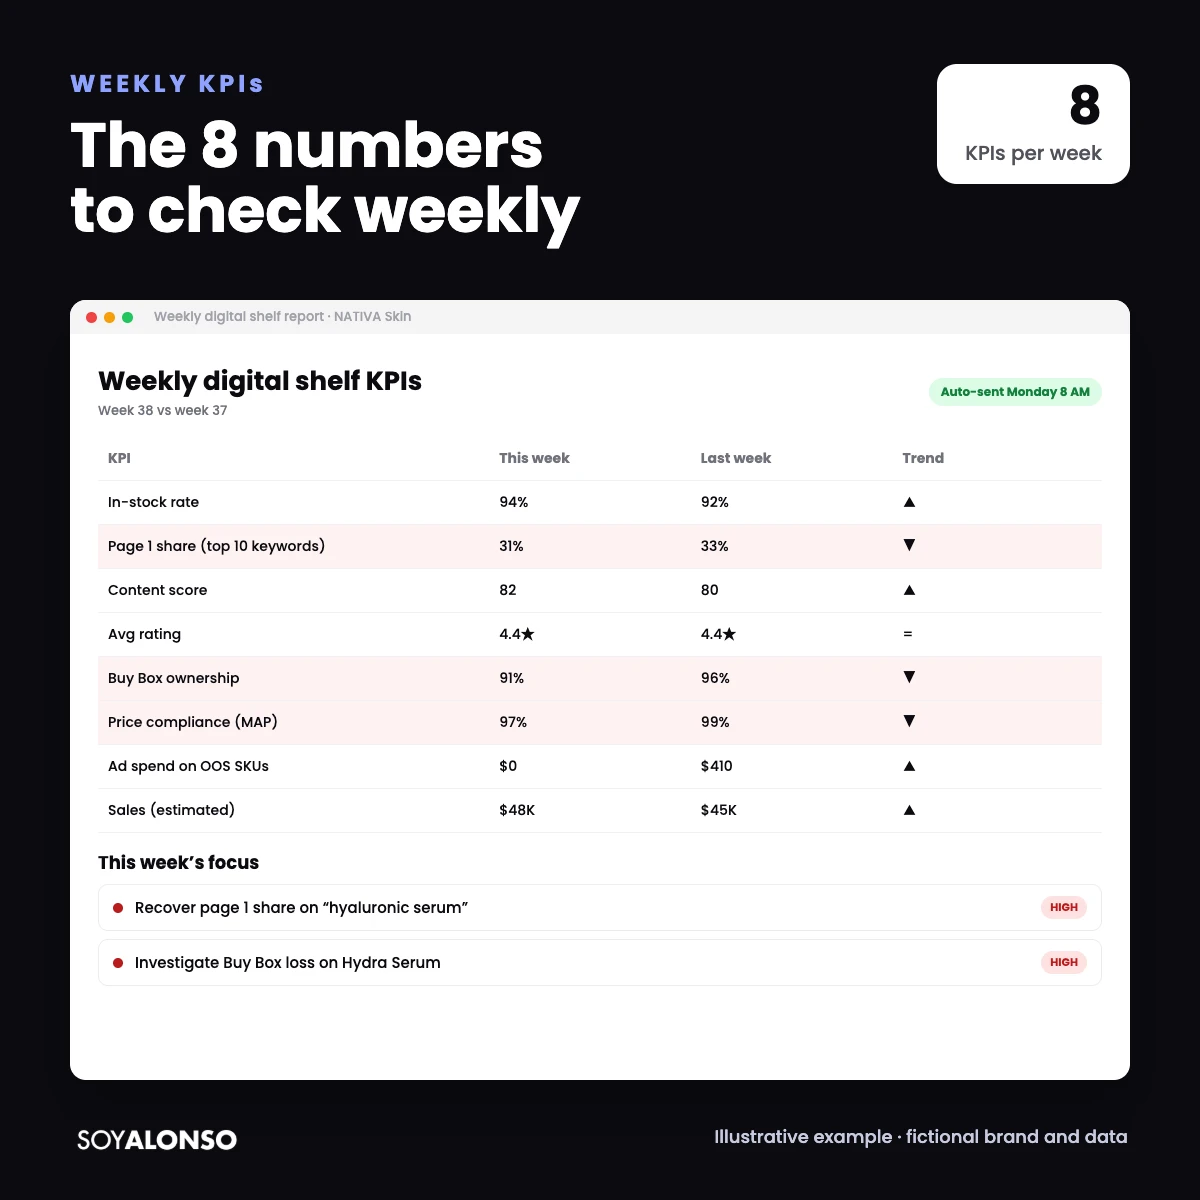
- The 8 KPIs: availability, page 1 share, content, rating, Buy Box, price compliance, spend on out-of-stock SKUs and sales.
- Every KPI needs a threshold and an owner; otherwise it is decoration.
- You can build it with Profitero, another tool or even Looker Studio with retailer data.
IN THIS ARTICLE
Digital shelf tools generate hundreds of data points a day. The challenge is not having information, it is knowing what to look at. After years managing accounts on Amazon, Walmart and Mercado Libre, my weekly dashboard came down to 8 KPIs. Here is what they are, which thresholds I use and how to turn them into decisions. If you are new to this category of tools, read what Profitero is.
Why a weekly dashboard
Daily is too noisy and monthly is too late. A weekly review lets you see trends and react before a dip turns into a bad month. Daily alerts are for urgent things (an out-of-stock, a lost Buy Box); the weekly dashboard is for deciding.
The 8 KPIs
| KPI | What it measures | Why it matters |
|---|---|---|
| 1. Availability (in-stock) | Share of SKUs and stores with inventory | No stock means no sale and no profitable ad |
| 2. Page 1 share | How much of the first page you own on your keywords | Visibility versus competitors |
| 3. Content score | Quality and completeness of your listings | Relevance and conversion |
| 4. Average rating | Stars on your top SKUs | Trust and conversion |
| 5. Buy Box ownership | Share of time your offer holds the Buy Box | Sales that could go to other sellers |
| 6. Price compliance (MAP) | Share of offers respecting your minimum price | Margin and channel relationships |
| 7. Spend on out-of-stock SKUs | Ad spend on products without stock | Wasted money |
| 8. Sales (actual or estimated) | The bottom line | The metric everyone watches |
Thresholds and owners
A KPI without a threshold drives no action. These are the thresholds I usually start with (adjust them to your category):
| KPI | Alert threshold | Typical owner |
|---|---|---|
| Availability | Below 90 percent | Supply chain / sales |
| Page 1 (brand terms) | Below 80 percent on your brand keywords | Media |
| Content | Below 75 points | Ecommerce / content |
| Rating | Drop of 0.2 stars in a month | Product / ecommerce |
| Buy Box | Below 90 percent | Sales / operations |
| MAP price | Any violation on top SKUs | Sales / legal |
| Spend on out-of-stocks | Above zero | Media |
How to build the dashboard
- Choose the source for each KPI: a digital shelf tool (such as Profitero), retailer reports or your ad platform.
- Limit the dashboard to your top 10 to 20 SKUs and key retailers.
- Always show the current week against the previous one and the 4-week average.
- Use color only for what breaks a threshold.
- Automate delivery (for example, every Monday at 8 am).
According to its official site, Profitero delivers data through its web app, exports and Snowflake, so you can also bring its data into your own BI tool.
The 15-minute meeting
Only red KPIs: what happened and who owns it.
4-week trends that worry you.
Agreements: owner, action and date.
If the meeting runs longer than 15 minutes, you are probably reviewing data that does not need a decision. Move it to the monthly report.
Common dashboard traps
Three traps show up again and again. First, mixing retailers in a single number: a 94 percent in-stock rate can hide a 60 percent at one retailer. Second, comparing against the wrong period, such as a promotional week against a normal one. Third, changing definitions without telling anyone, which makes trends meaningless. Keep a one-page glossary next to the dashboard with how each KPI is calculated and where the data comes from.
Agency secrets about dashboards
What I learned designing dashboards for clients:
Every KPI you add competes for attention with the others. Eight is my limit.
It shows saved money directly. Always include it.
Name the person who reviews and presents it every Monday.
The best dashboard I built for a client had a single screen and one rule: if something is red, someone leaves the meeting with a task.
I’m Alonso Jiménez, a Retail Media account director. I manage campaigns on Amazon, Walmart, Target, Instacart and Mercado Libre every day, for brands in the US, Mexico and Latin America. For budget tracking alongside the shelf, see Amazon Ads pacing.
Frequently asked questions
Which digital shelf KPIs matter most?
Availability, page 1 share, content score, rating, Buy Box, price compliance, spend on out-of-stock SKUs and sales.
How often should I review the dashboard?
Weekly for decisions, with daily alerts for urgent issues.
Can I build it without Profitero?
Yes, with retailer reports and your ad platform, for example in Looker Studio. The tool saves time when you have many SKUs.
How many SKUs should I include?
Start with your top 10 to 20. A short dashboard someone reviews beats a complete one nobody opens.