
⚡ THE ESSENTIALS IN 20 SECONDS
- A good QBR is not a long report: it is a story of what happened, why and what comes next.
- Digital shelf data explains the “why” the ad console cannot see.
- 4-block structure: what happened, why, what we learned and what is next.
- For Amazon vendors, modules such as Profitero AMZ Vendor Health help prepare QBRs and JBPs.
IN THIS ARTICLE
In my job I prepare QBRs (quarterly business reviews), monthly MBRs and weekly meetings with clients. After many quarters I learned something: clients do not want to see every metric, they want to understand their business. The best way to explain the business is to combine three layers: shelf, media and sales. Here is the structure I use and how data from Profitero or another digital shelf tool fits in.
What a QBR is (and is not)
QBR (Quarterly Business Review): a quarterly meeting between a brand and its agency or team to review results, explain their causes, share learnings and agree on priorities for the next quarter.
A QBR is not the monthly report multiplied by three. If the monthly report answers “how are we doing?”, the QBR answers “why are we doing this way and what are we going to change?”. That is why it needs data that explains causes, and that is where the digital shelf helps.
The 4-block structure
Sales, spend, ROAS and share for the quarter, against target and the previous quarter.
The causes: out-of-stocks, content, price, reviews, competition and campaigns.
Tests, mistakes and discoveries that change how we invest.
3 to 5 priorities with owner, date and target.
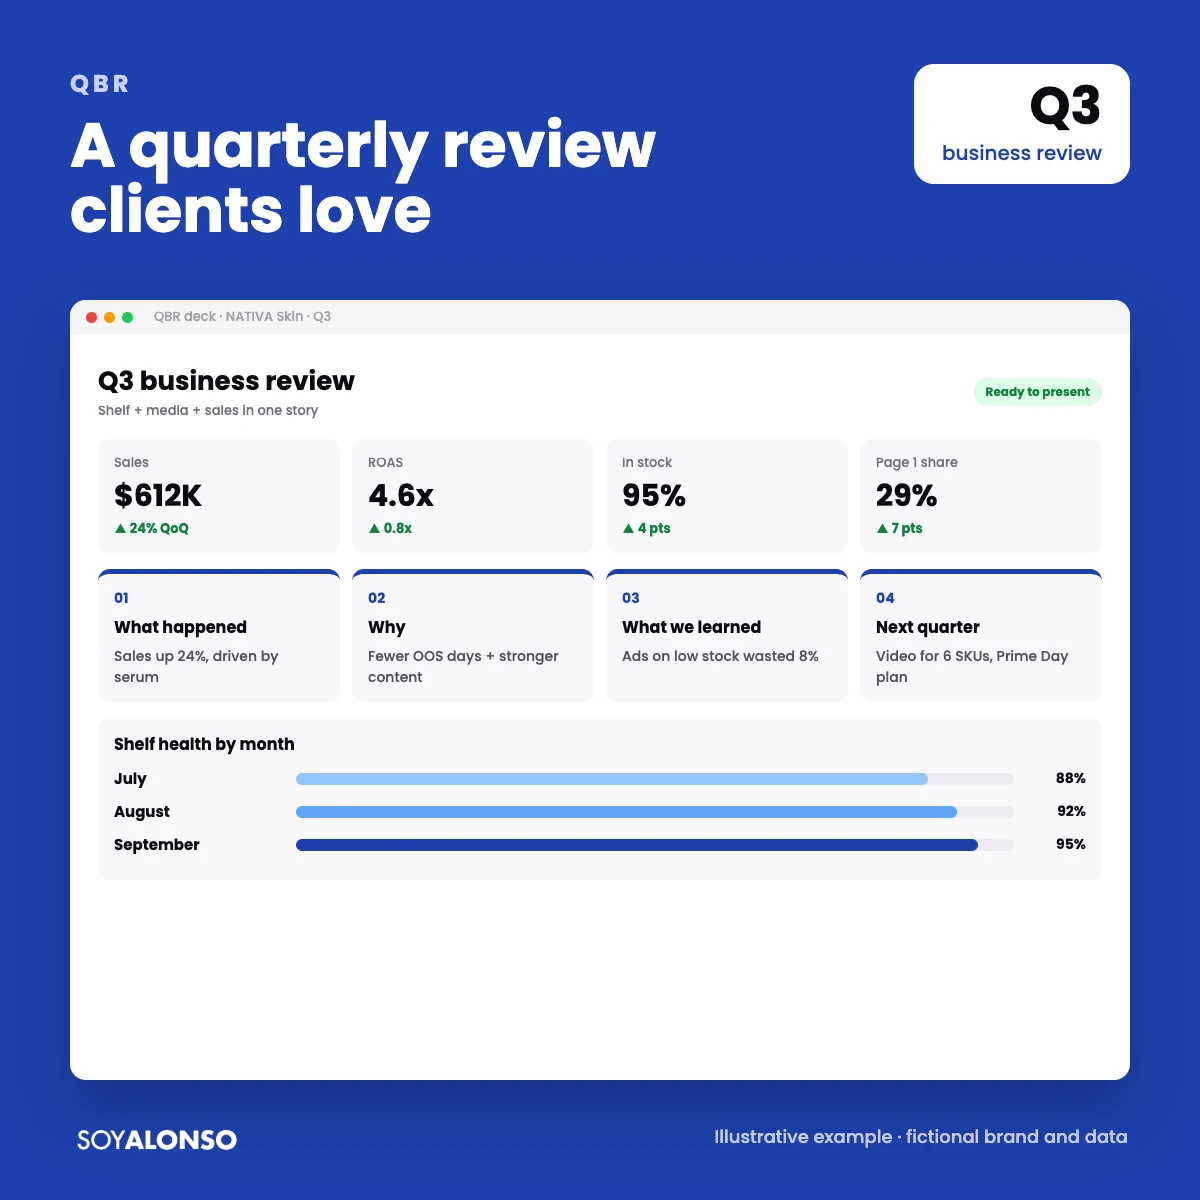
With this structure, a QBR fits in 10 to 15 slides. Everything else goes into an appendix for whoever wants the detail.
Which shelf metrics to include
| Metric | What it explains |
|---|---|
| Availability (in-stock) | Lost sales and wasted spend from out-of-stocks |
| Page 1 share | Whether you gained or lost visibility versus competitors |
| Content score | Changes in conversion |
| Average rating | Shopper trust and conversion |
| Buy Box ownership | Sales that went to other sellers |
| Estimated market share | Whether you grew faster or slower than the category |
How Profitero helps
Profitero provides the shelf layer (availability, search, content, price and reviews) and, with Sales & Share, Amazon sales and share estimates. For vendors, its AMZ Vendor Health module combines Vendor Central data with Profitero data and, according to its site, is designed for JBP and QBR preparation, with metrics such as Net PPM, brand share of sales, procurable out-of-stock, weeks of cover, glance views and customer returns.
You do not need Profitero to run a good QBR, but you do need the shelf layer from some source: a tool, retailer reports or manual reviews.
Common mistakes
- Showing 60 slides. If everything is important, nothing is.
- Only talking about media. Clients want to understand sales, not just ROAS.
- Hiding what went wrong. Learnings build more trust than wins.
- Ending without agreements. Every QBR should close with priorities, owners and dates.
- Not connecting with the previous QBR. Start by reviewing whether last quarter’s commitments were met.
How to prepare the QBR without burning out
A good QBR starts three weeks earlier. In week one I pull sales, media and shelf data into a single file. In week two I write the story on one page: the main message, the three causes and the five priorities, still without slides. Only when the story is clear do I build the deck. I use the last week to validate numbers with the client and rehearse. This order avoids the most common mistake: designing pretty slides before knowing what you want to say. It also makes the review faster, because everyone discusses the story rather than the formatting.
Agency secrets for QBRs
What I learned presenting QBRs to directors:
The first slide should state the main message in one sentence. The rest proves it.
Every slide with a title that says what the data means, not what the data is.
“If we fix the out-of-stocks on SKU X, we estimate +8 percent sales” beats “we need to improve inventory”.
My best QBRs were the ones that explained a drop honestly and ended with a clear plan. Clients remember how you reacted more than the number.
I’m Alonso Jiménez, a Retail Media account director. I manage campaigns on Amazon, Walmart, Target, Instacart and Mercado Libre every day, for brands in the US, Mexico and Latin America. In my day-to-day I prepare QBRs, MBRs, weekly meetings and dynamic pacing dashboards for my clients. For budget tracking, see Amazon Ads pacing.
Frequently asked questions
What is a QBR in Retail Media?
A quarterly business review that analyzes results, causes, learnings and priorities for the next quarter.
What is the difference between a QBR and an MBR?
The MBR is monthly and more operational; the QBR is quarterly, more strategic and focused on causes and decisions.
How many slides should a QBR have?
Between 10 and 15 in the main deck, with appendices for detail.
Do I need Profitero for a QBR?
No, but you do need shelf data. Profitero is one source; retailer reports and manual reviews also work.